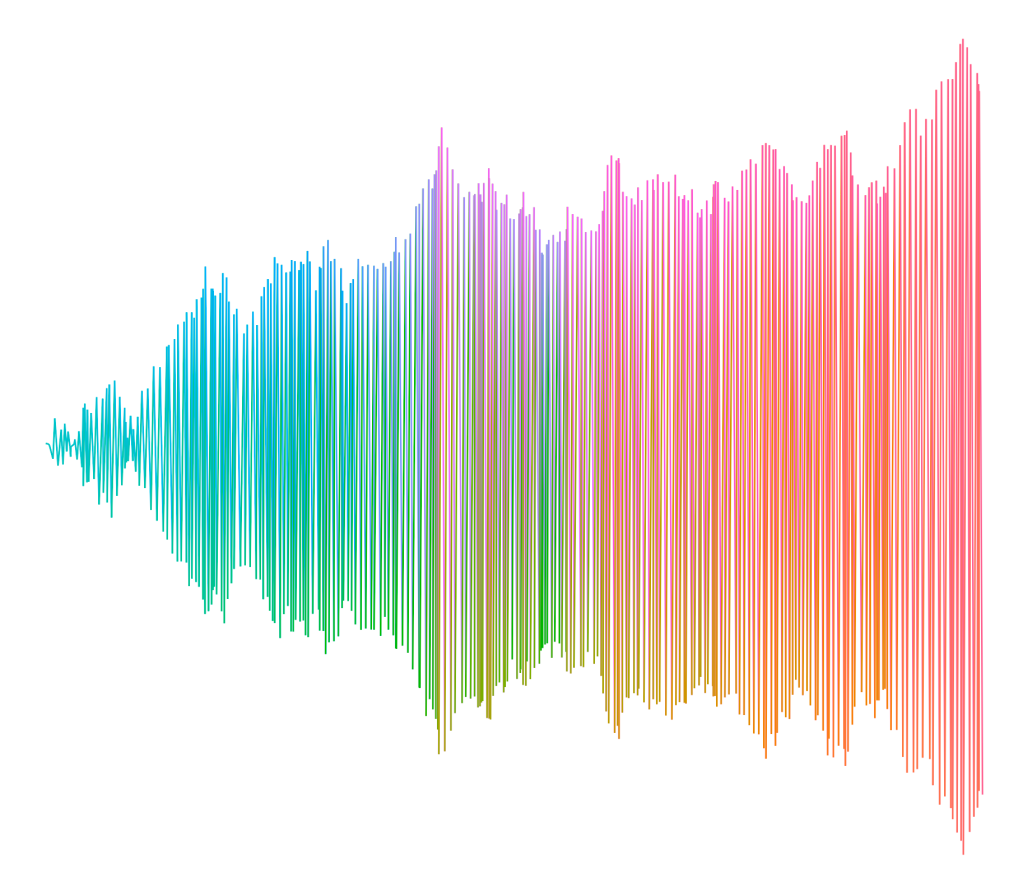
How about some colours in line graph? Or even more wacky? Nevertheless, let’s create a function that generates some sample “mocked” data and draws a line chart: And run all together with three parameters: n – number of data points…Read more › The post Little useless-useful R functions – Colourful ggplot line graphs first appeared on R-bloggers.
http://dlvr.it/S3tZB0


تعليقات
إرسال تعليق