Click to see R set-up code # Libraries if(!require("pacman")) { install.packages("pacman") } pacman::p_load( data.table, re2, scales, ggplot2, plotly, DT, patchwork, survival, ggfortify, scales) # Set knitr params knitr::opts_chunk$set( comment = NA, fig.width = 12, fig.height = 8, out.width = '100%' )
NOTE: The read time for this post is overstated because of the formatting of the Plotly code. There are ~2,500 words, so read time should be ~10 minutes.
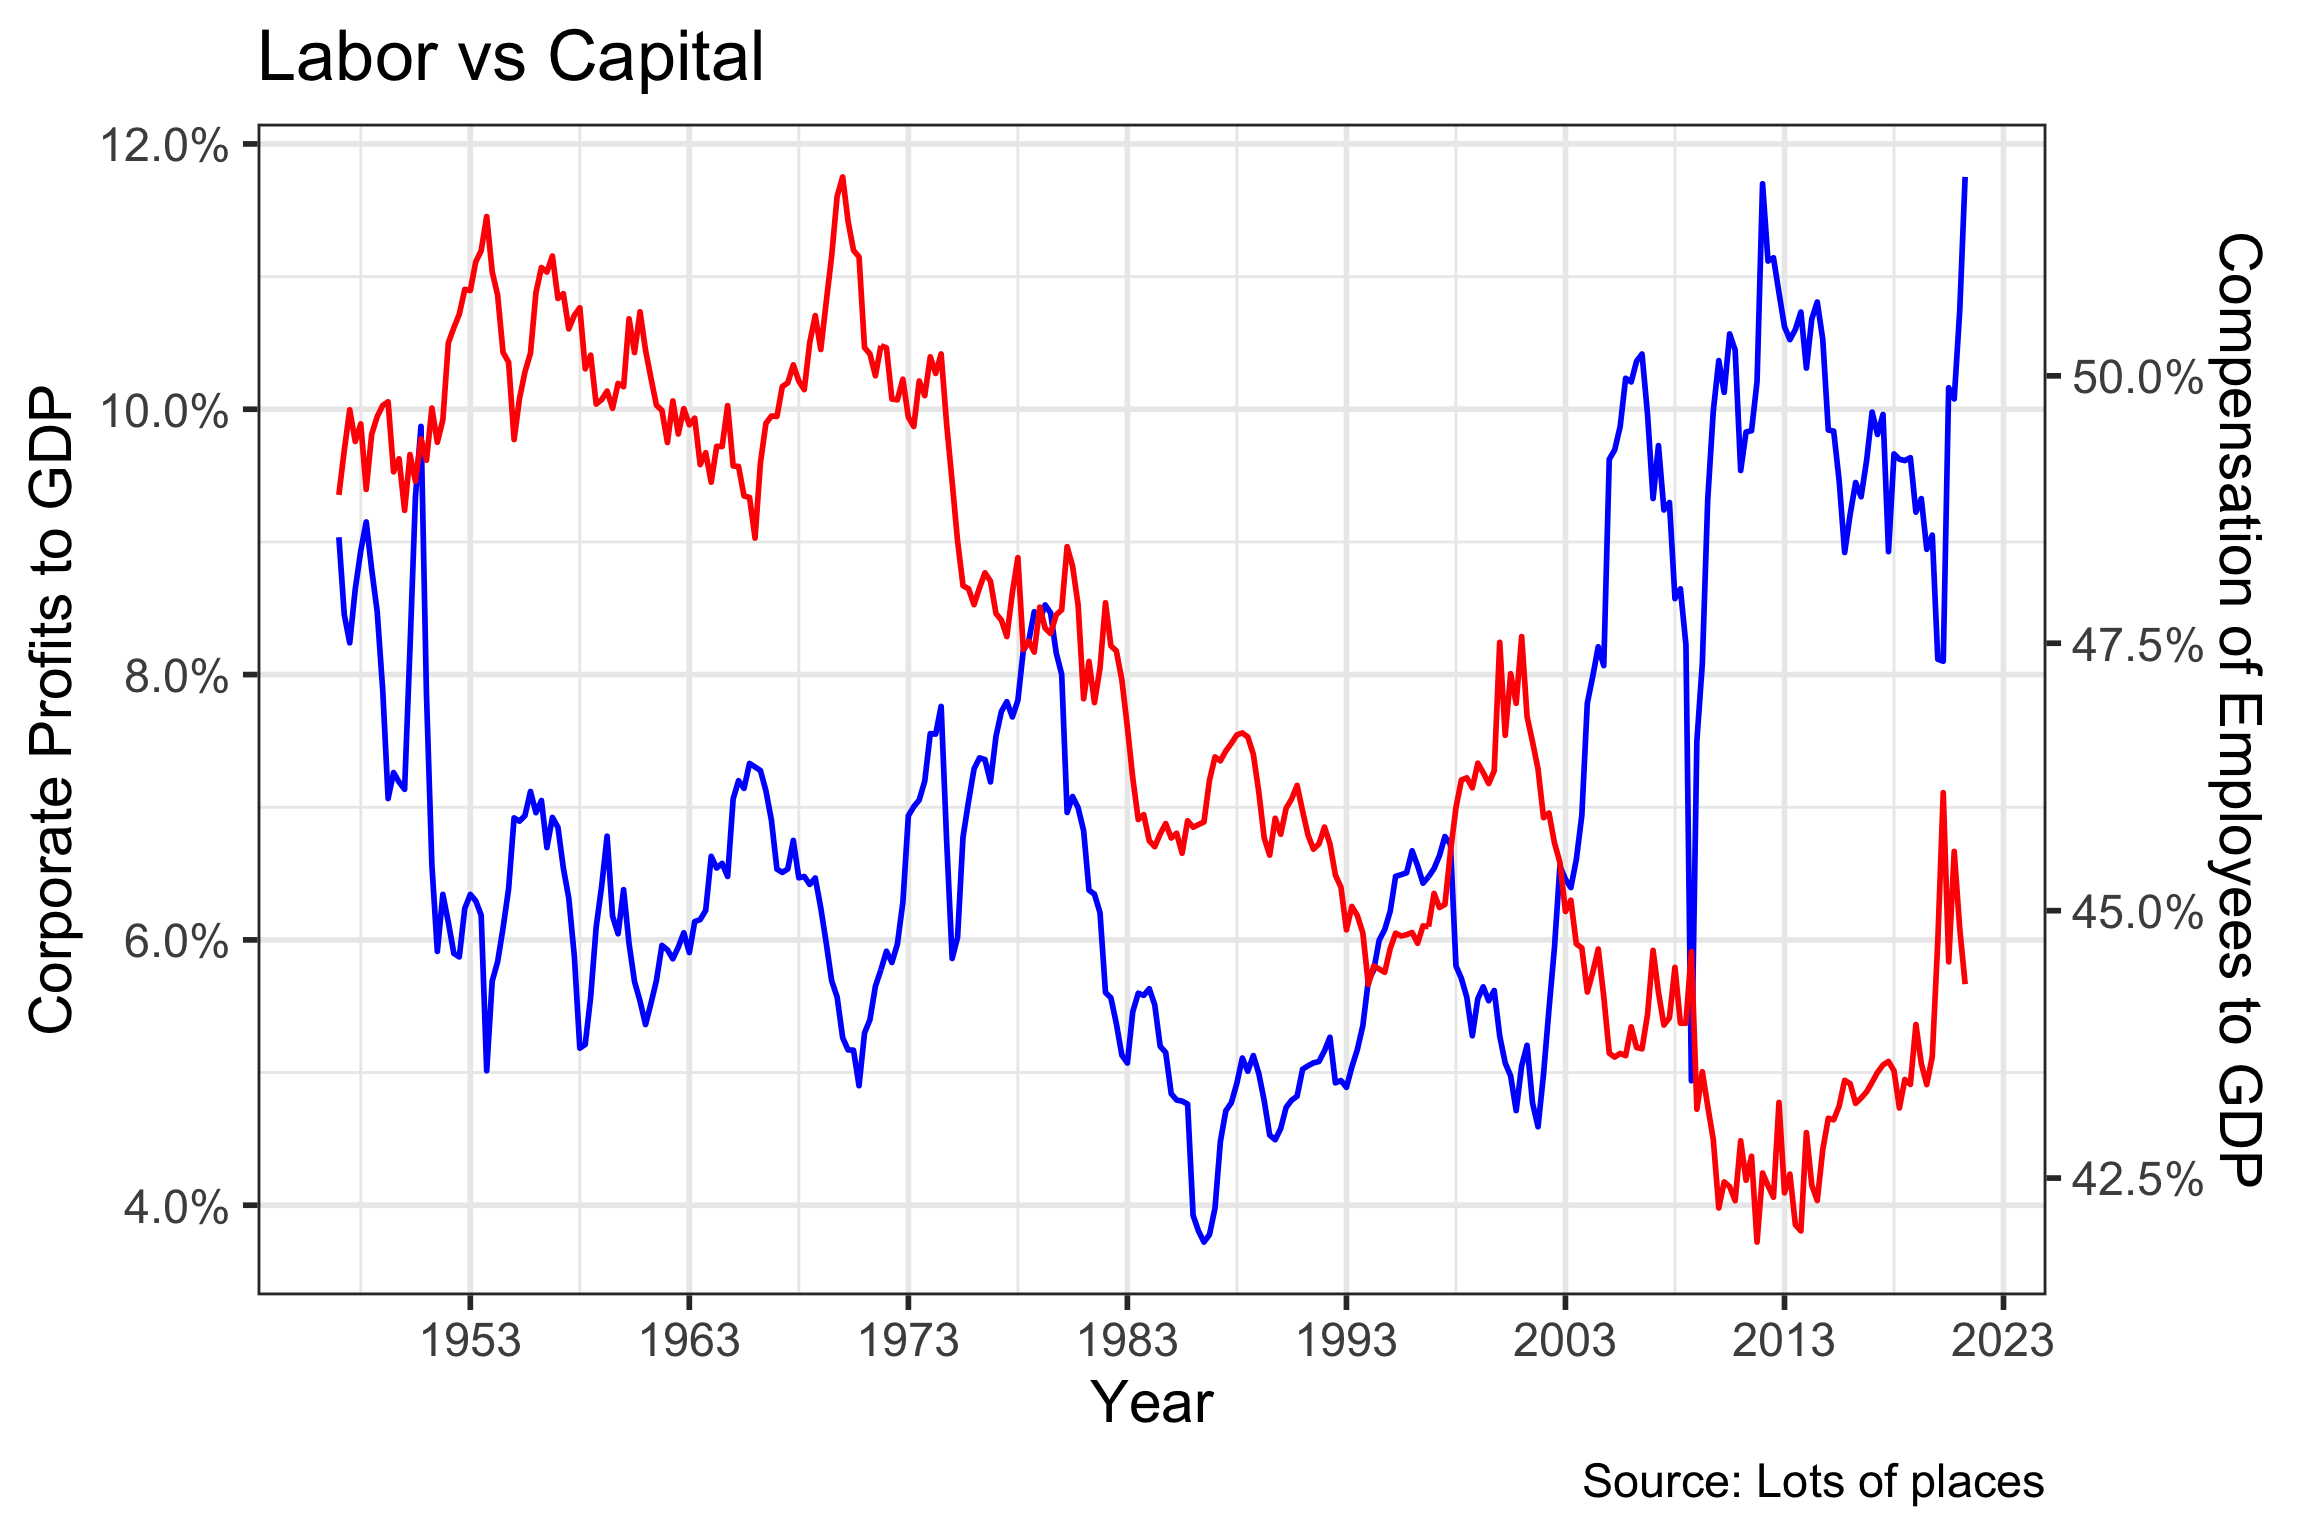
Click to see R code generating plot # Load function to plot dual y-axis plot source("train_sec.R") # Get data series from FRED symbols
http://dlvr.it/S6h0S4


تعليقات
إرسال تعليق