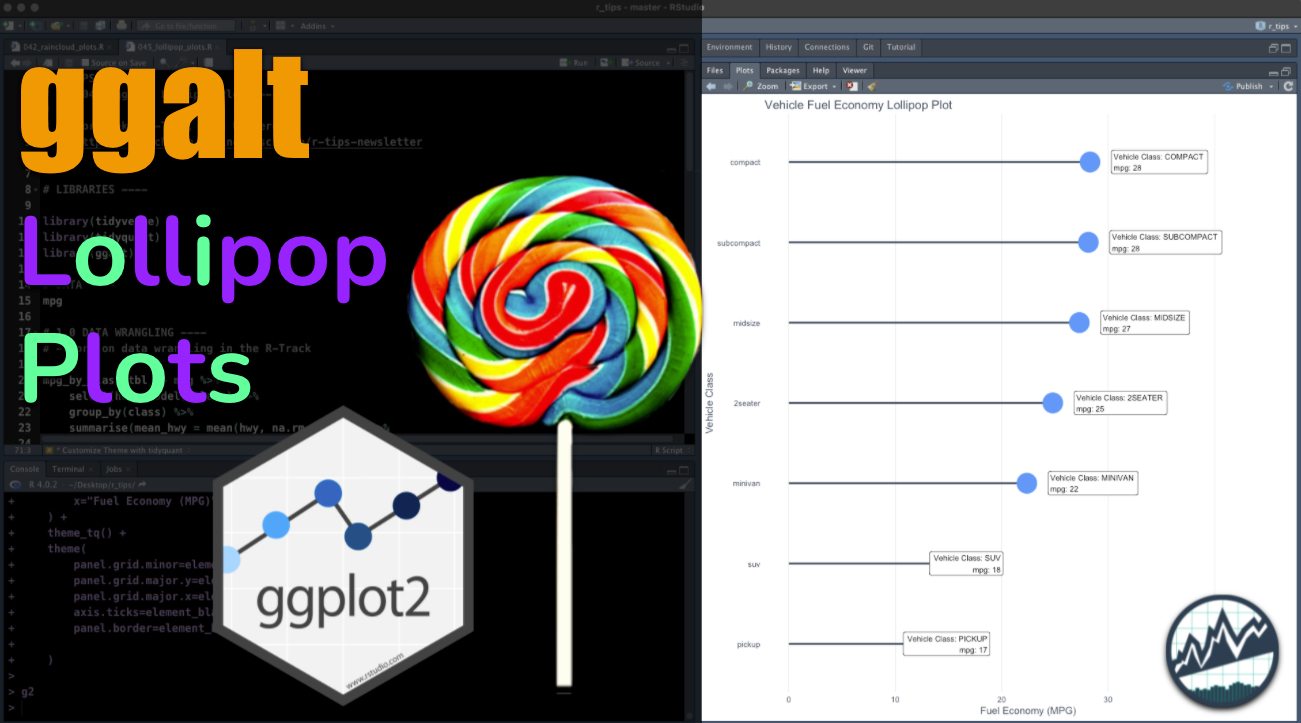
A Lollipop Plot shows the relationship between categories using a dot and a line that connects to a baseline (similar to a Bar Plot). In this short tutorial, we use ggalt to create a Lollipop Plot with the geom_lollipop() function.
R-Tips Weekly
This... Continue reading: ggalt: Make a Lollipop Plot to Compare Categories in ggplot2
http://dlvr.it/S6FlbD


تعليقات
إرسال تعليق