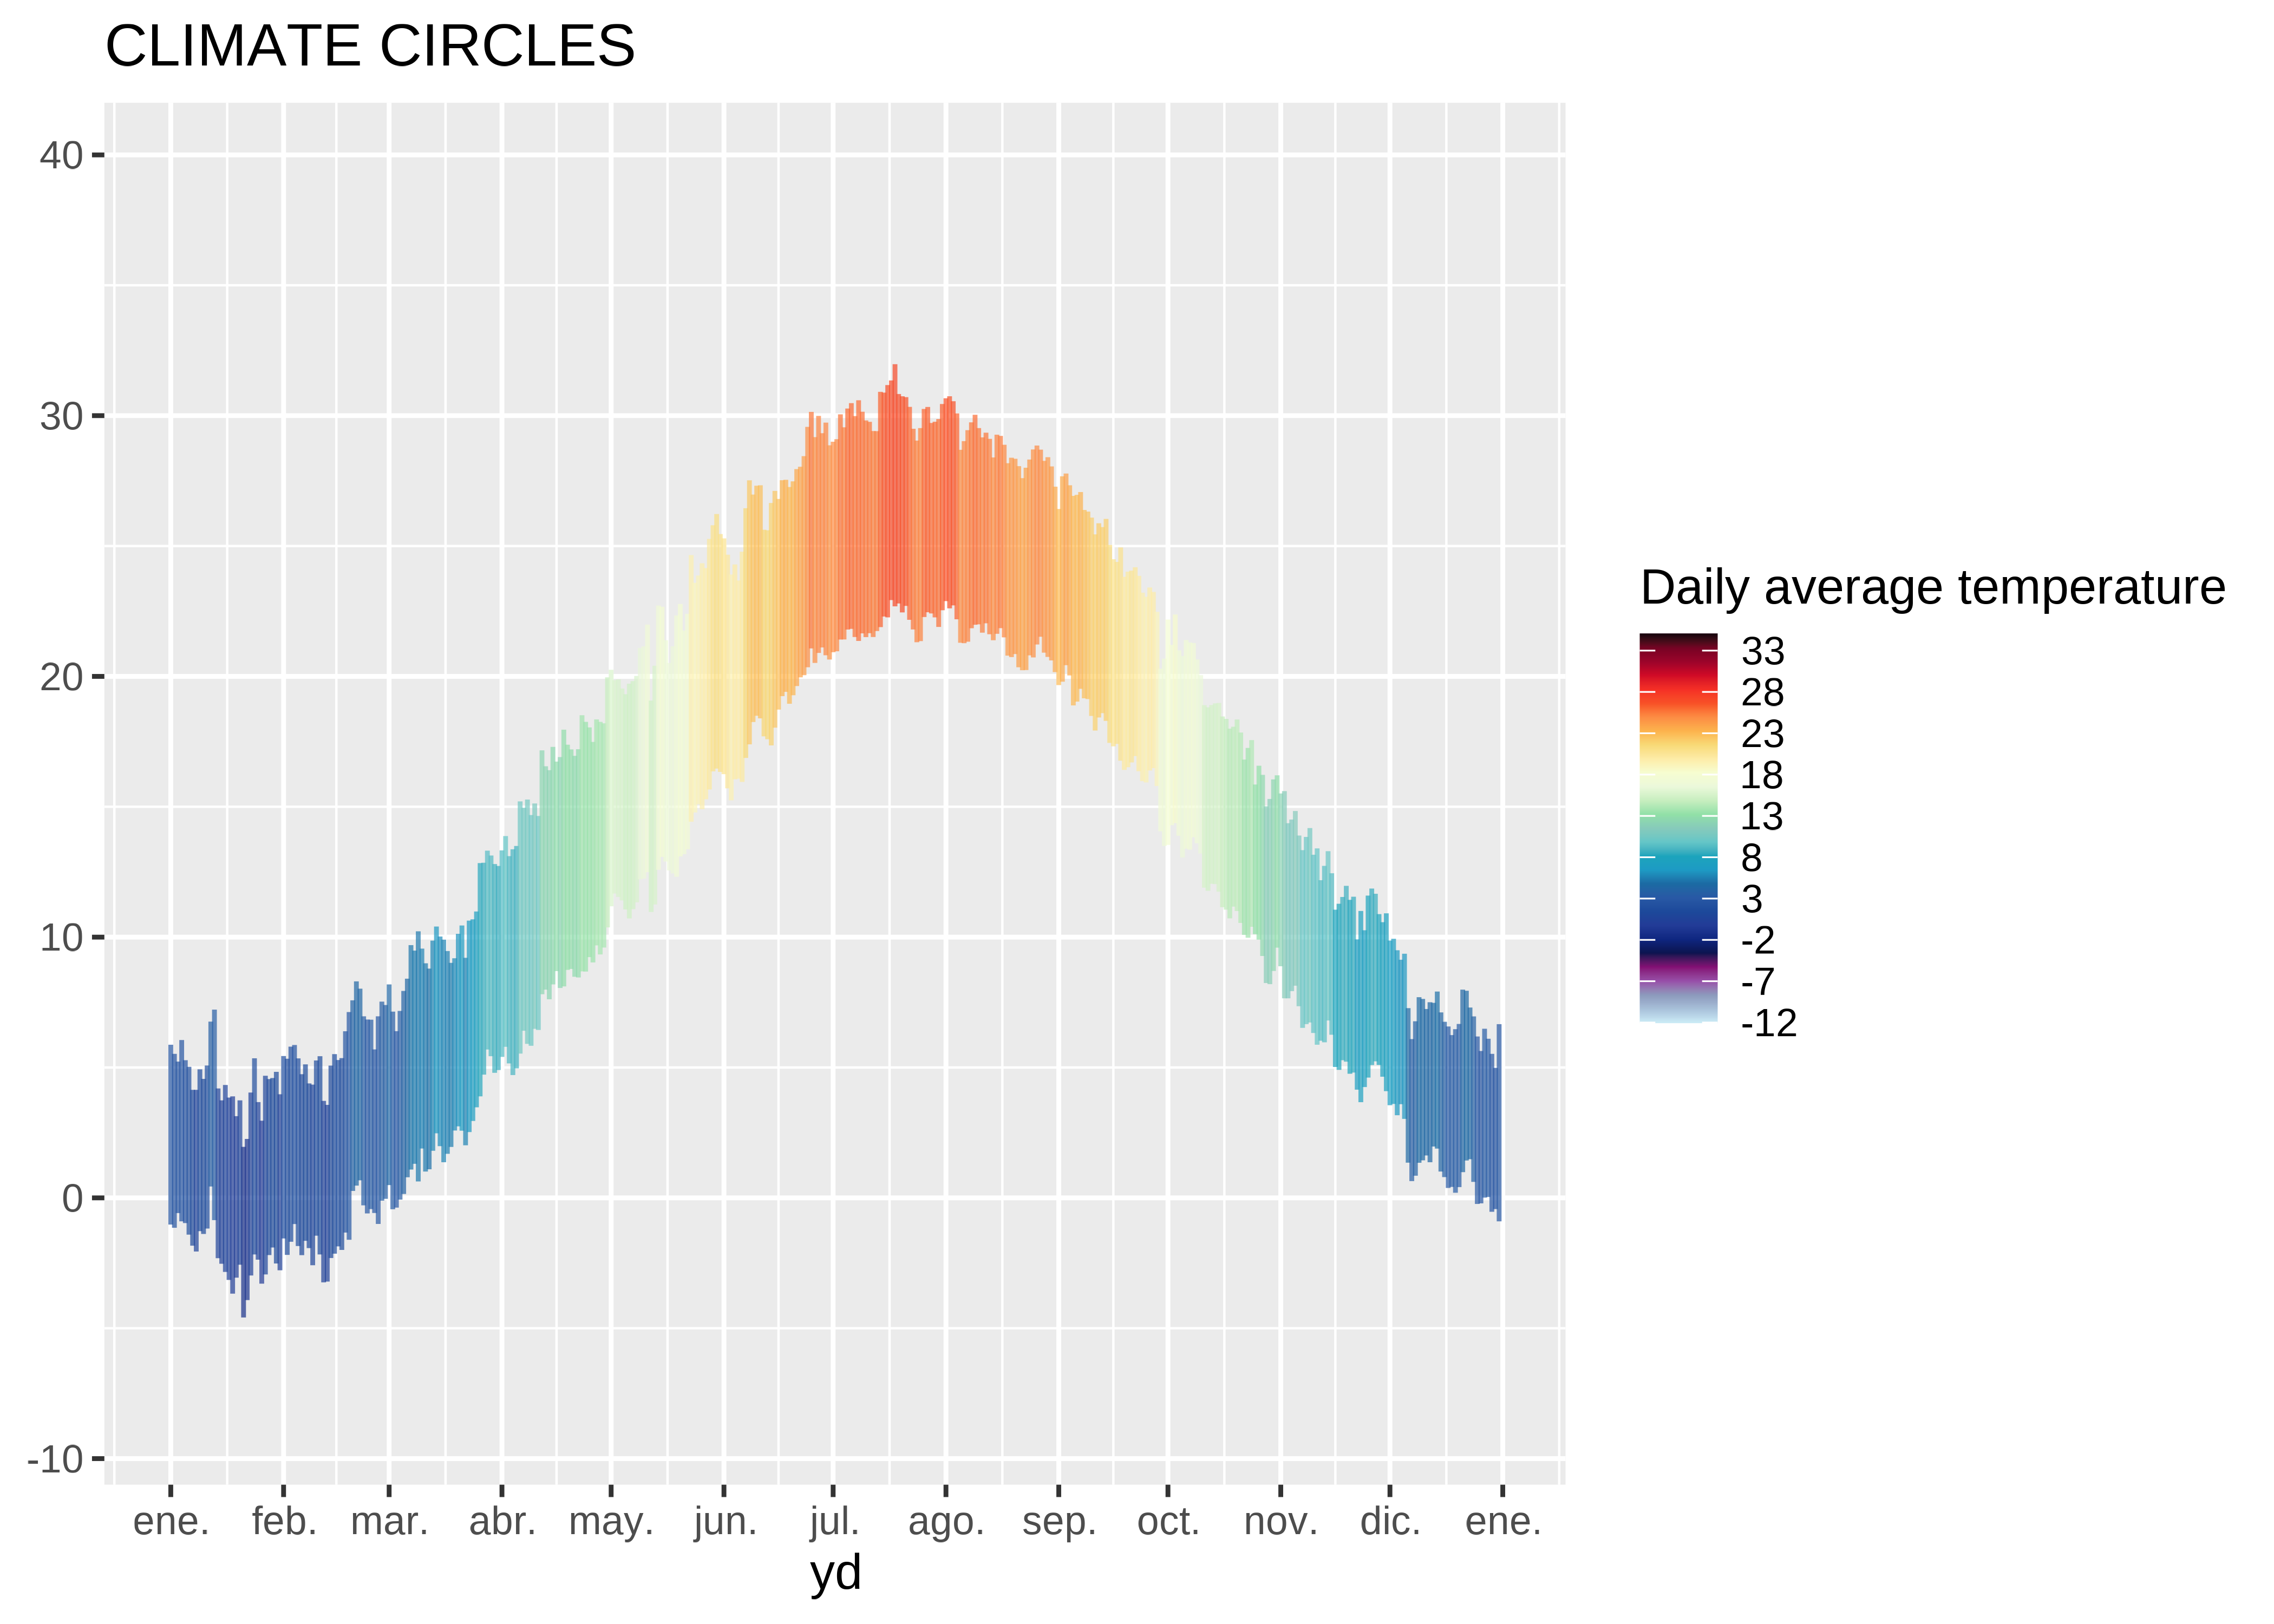
The climate of a place is usually presented through climographs that combine monthly precipitation and temperature in a single chart. However, it is also interesting to visualize the climate on a daily scale showing the thermal amplitude and the daily average temperature. To do this, the averages for each day ... Continue reading: Climate circles
http://dlvr.it/S6yCpP


تعليقات
إرسال تعليق