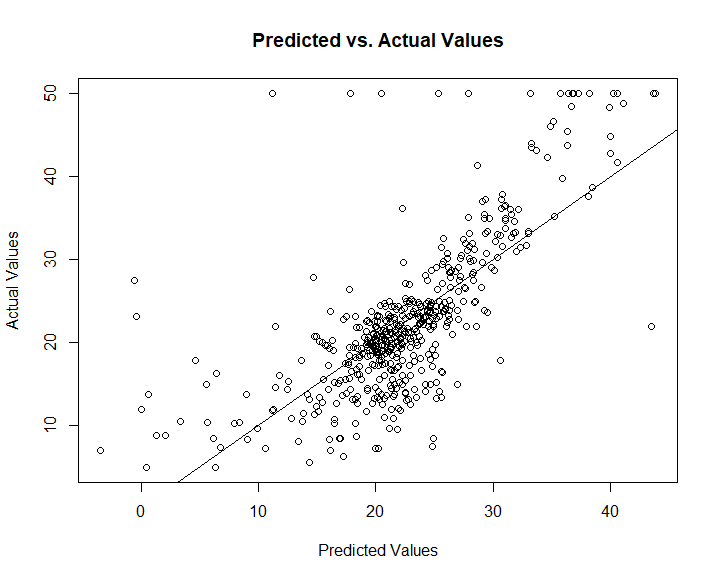
Plot Observed and Predicted values in R, In order to visualize the discrepancies between the predicted and actual values, you may want to plot the predicted values of a regression model in R. This...
The post How to Plot Observed and Predicted values in R appeared first on finnstats. Continue reading: How to Plot Observed and Predicted values in R
http://dlvr.it/SC1Rh1


تعليقات
إرسال تعليق