Introduction
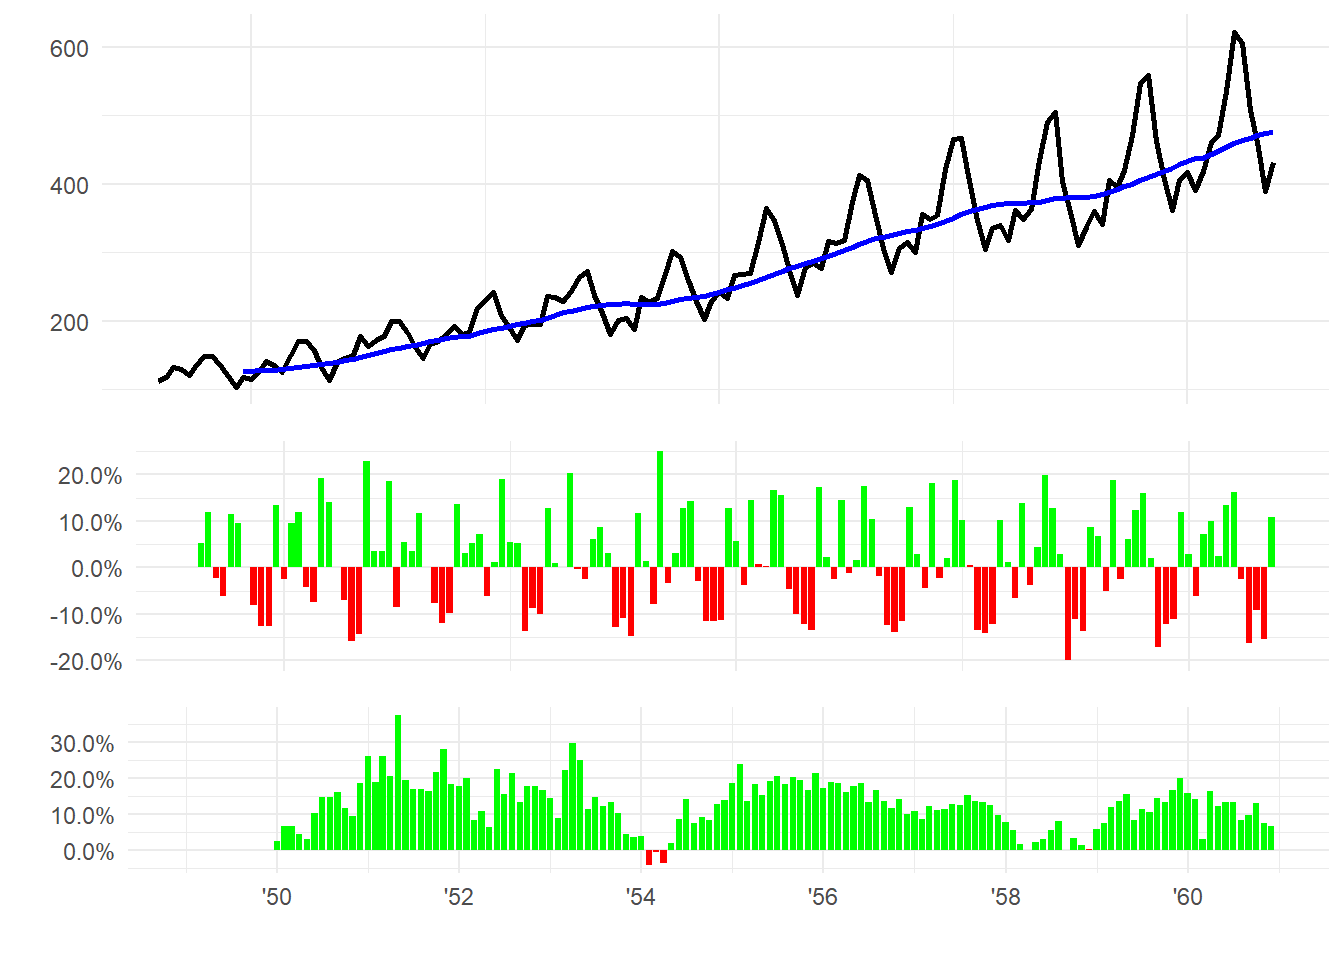
Are you interested in visualizing time series data in a clear and concise way? The R package {healthyR.ts} provides a variety of tools for time series analysis and visualization, including the ts_ma_plot() function.
The ts_ma_plot()...
Continue reading: Moving Average Plots with {healthyR.ts}
http://dlvr.it/SjVSQv


تعليقات
إرسال تعليق