Unveiling Roman Amphitheaters with a ggplot2 violin plot
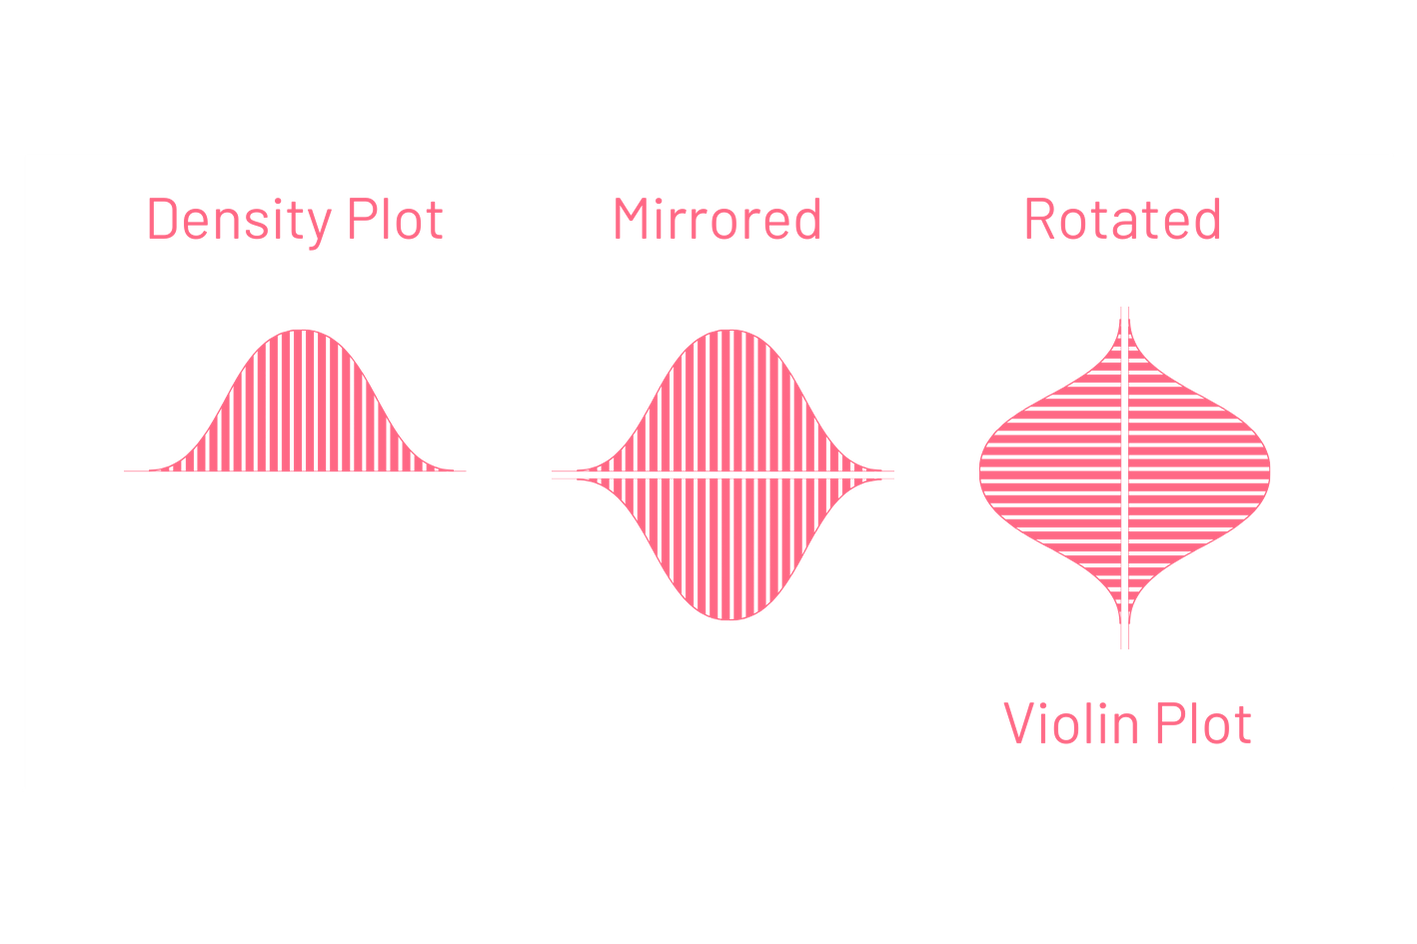
A violin plot is a mirrored density plot that is rotated 90 degrees as shown in the picture. It depicts the distribution of numeric data.
2. When should you use a violin plot?
A violin plot is useful to compare the ...
Continue reading: Unveiling Roman Amphitheaters with a ggplot2 violin plot
http://dlvr.it/T2cQ1W


تعليقات
إرسال تعليق