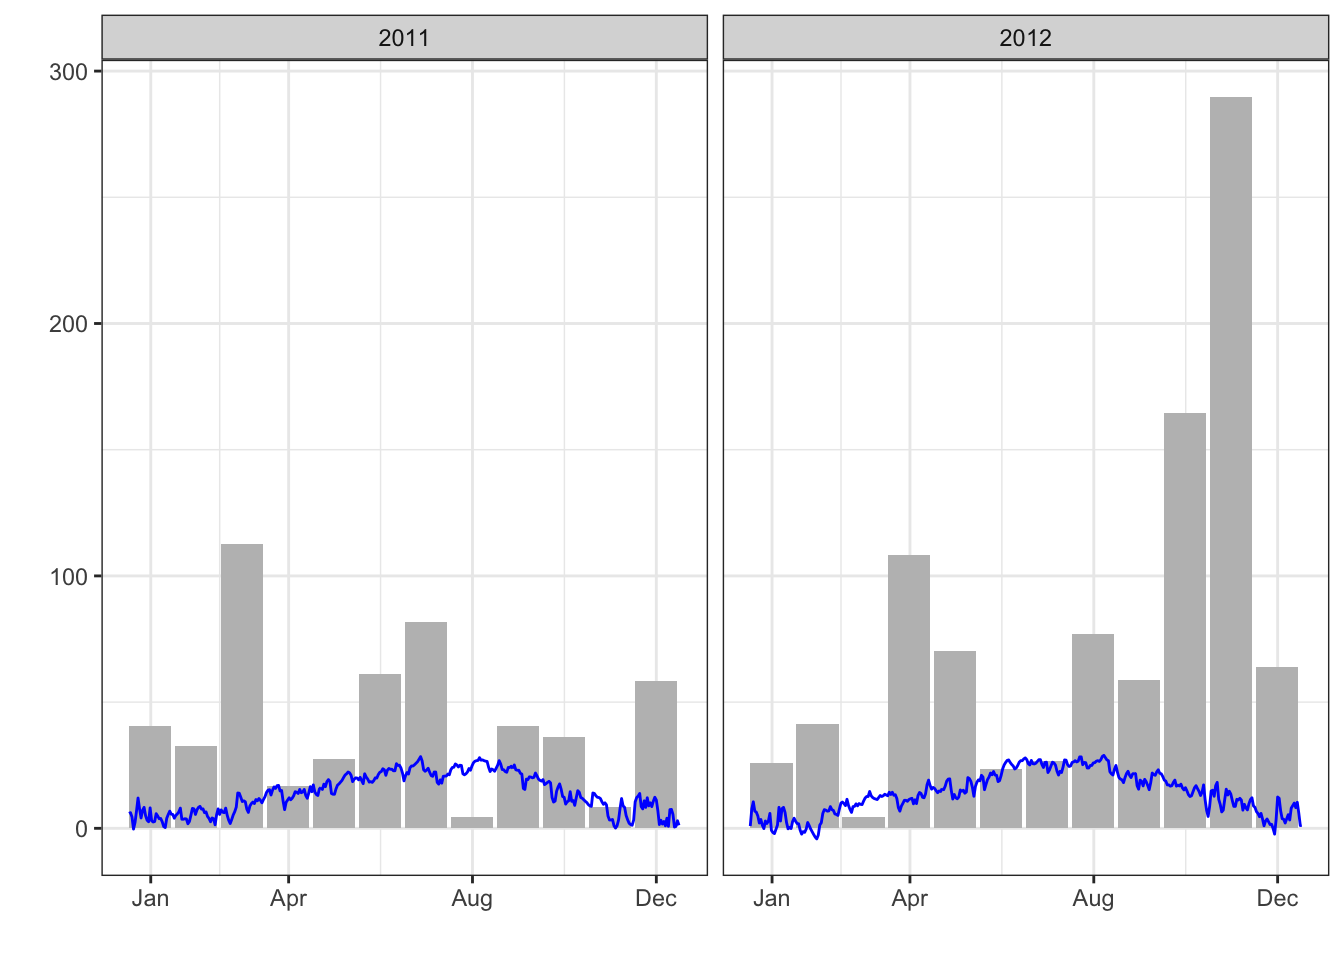
Very often, we agronomists have to deal with weather data, e.g., to evaluate and explain the behaviour of genotypes in different environments. We are very much used to representing temperature and rainfall data in one single graph with two y-axis, w...
Continue reading: Plotting weather data with ggplot()
http://dlvr.it/T7RCZV


تعليقات
إرسال تعليق