Boost your shiny app with sparkling data visualizations: a deep dive into Chart.js JavaScript library
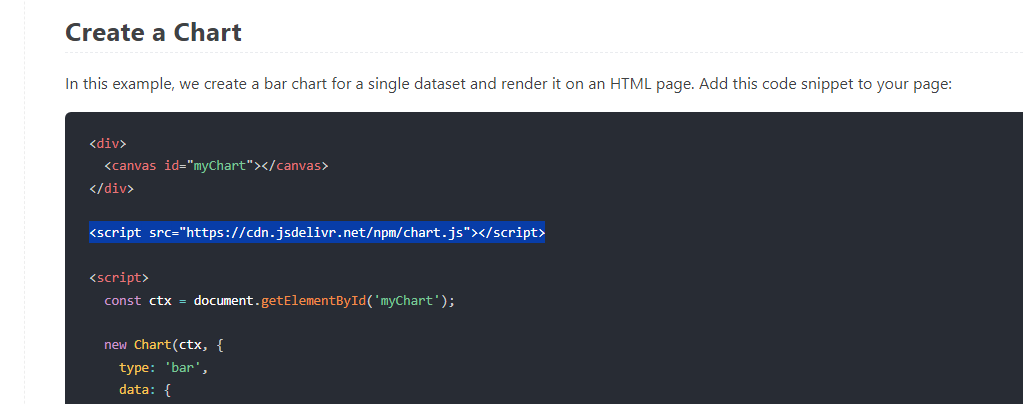
Let’s continue our exploration of integrating JavaScript code into a {shiny} application! We will show how to ...
Continue reading: Boost your shiny app with sparkling data visualizations: a deep dive into Chart.js JavaScript library
http://dlvr.it/TCmHW9


تعليقات
إرسال تعليق